Result Visualisation
This section aims to show how the results page is organised.
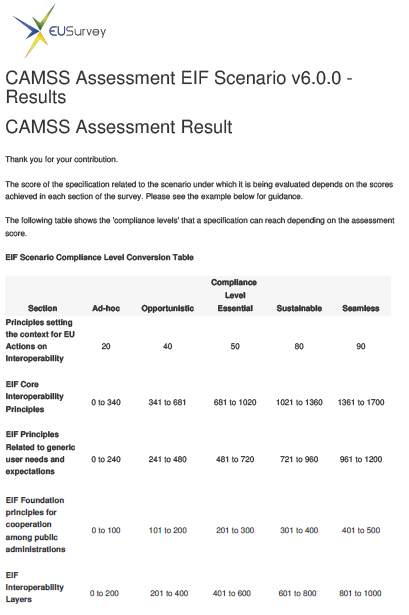
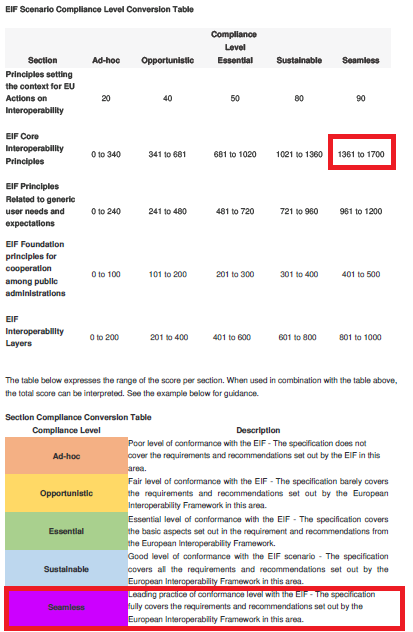
At the top of the page, the user will see the "Scenario Compliance Level Conversion Table". This table states the different compliance level and the description of each one. The interpretation of the results will be further explained within the next section "Results Visualisation".
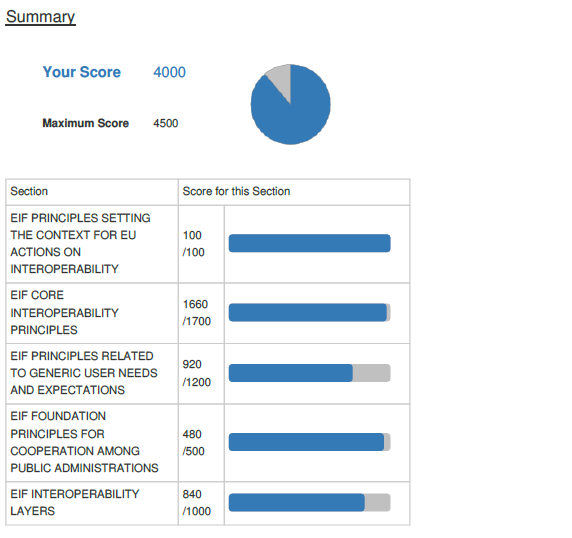
The first element after the tables for the interpretation of the results is the “Summary section”. This section provides an overall view of the total score reached and the score per section.
In second place, going down in the page result it shows the score per question:
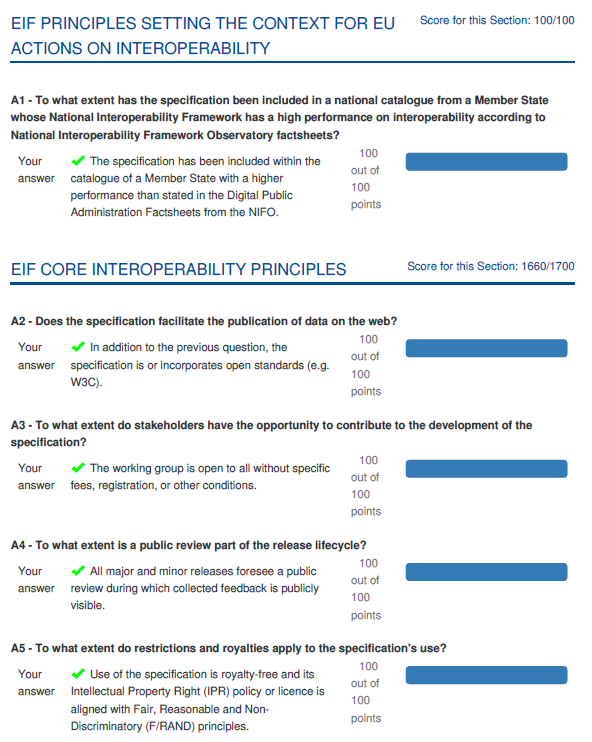
Note that this is just a snapshot of how it is represented, the section covers all sections and criteria.
Additionally, a pdf version of the assessment and results can be retrieved. To know how to get the PDFs of the assessment and the results please check the section “Get assessment in pdf. Result and form”
The following image is an extraction of a PDF generated with dummy values as an example. The document includes all the answers and justifications provided by the user.
Result Interpretation
After presenting how EU Survey represents the information of the results, now it is the turn of the interpretation of these results.
There are two aspects to consider: the score obtained directly from the assessment as shown before and the assessment strength.
- The score reached on the assessment is called automated score. And a conversion table needs to be used to get value and meaning.
- The assessment strength is an additional score that complements the automated score. It is further explained later in this section.
Assessment Score
Once the user has submitted the questionnaire, the results page shows a conversion table as presented within the previous version. See the conversion tables below:


Exemplification of how to interpret the results (Assessment Score - Your Score):
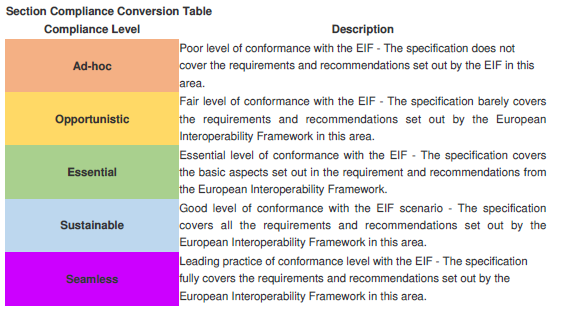
This "Section Compliance Conversion Table" is related to the score of the assessment and each section. Then, having the summary of results per section and taking the EIF Core Interoperability Principles as reference:
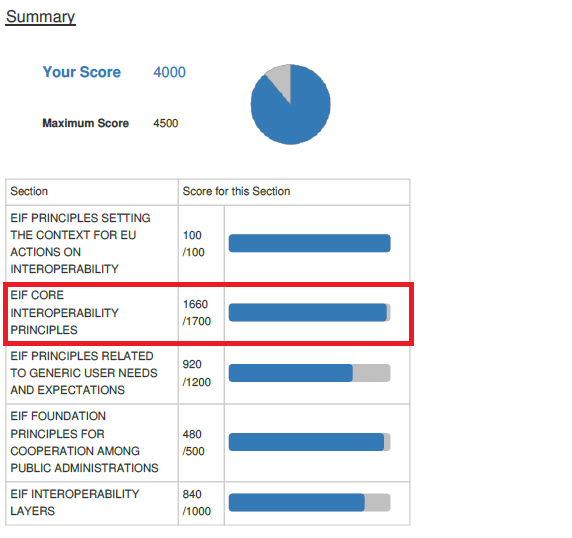
In the image above the score for this section is 1660, which is the maximum for this section as it can be read in the following image:
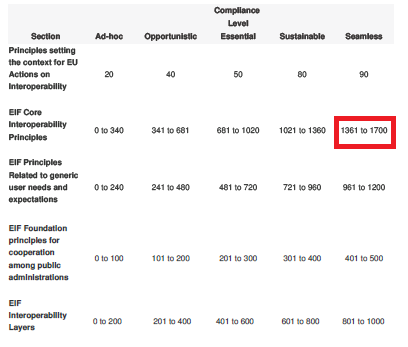
Therefore, the specification being assessed "is fully compliant with the requirements and recommendations set out by the European Interoperability Framework in this specific area". See the following images for clarification:
Exemplification of how to interpret the results (% Assessment Score):
Besides, the user might also get a percentage (%) of the overall assessment score. The % of the overall assessment score consists of the division between the total assessment score (Your Score) and the maximum assessment score (Maximum Score), where the % of the overall assessment score will not be considering the value of N/A (100 points).
Both parts of the fraction must be subtracted by the number of N/A answers 100 times. Then if from 3800 out of 4500 points there are 4 N/A answers, the current formula for calculating the % of the overall assessment score is (3800-4*100)/(4500-4*100)*100= 83%:
Example of this applicability in the EIF context:
Having that an assessment contains:
- 35 positive answers (YES)
- 6 negative answers (NO / Gradient Answer 20 points)
- 4 N/A answers.
And the formula is: [ (Your Score - # of N/A answers * 100) / (Maximum Score - # of N/A answers * 100) ]
Therefore, it would apply like this:
(3800-4*100)/(4500-4*100)*100= 83%
That is 83%, slightly lower than the initial 3800/4500*100 = 84%.
Assessment strength
The assessment strength aims to provide complementary information regarding the comprehensiveness of the assessment. This information is partially expressed in the results above.
Considering that the value of N/A is 0, it can affect the final result of the specification, however, it allows to see how strong the evaluation can be considered counting the % of positive and negative answers.
In this sense, the assessment strength purpose is to balance and complement these questions that have not been answered with negative or positive providing a % that can reflect the comprehensiveness and scale of accomplishment of the assessment by the evaluator.
The formula to calculate the assessment strength is:
[ ((Count (POSITIVE) + Count (NEGATIVE*)) / # of questions/criteria in scenario) * 100 ]
*Please note that the NEGATIVE answers include the "NO" and the gradient answers with a score of 20 points.
It works as follows:
- Count the POSITIVE answers
- Count the NEGATIVE answers
- Sum them
- Divide into the total number of questions (45)
- Multiply per 100 to get the percentage.
After applying the formula below to the results, the outcome will be a %. This percentage must be read on the following scale:
The higher is the % reached, the higher is the comprehensiveness of the assessment. Meaning that most of the questions have been answered positive or negative avoiding the usage of N/A possibility.
The following image is an example of the inputs needed to apply the formula.
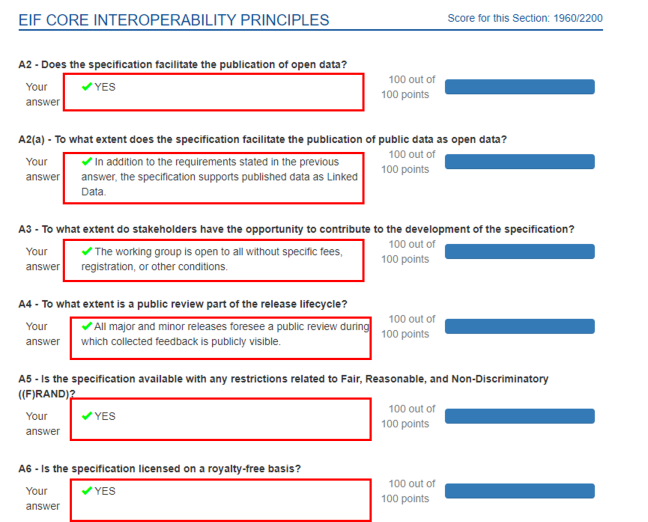
As the image shows, within Scores By Question, the users can read the responses given to each question in the form, which need to be used as inputs for the calculation.
Example of this applicability in the EIF context:
Having that an assessment contains:
- 32 positive answers (YES)
- 5 negative answers (NO / Gradient Answer 20 points)
- 8 N/A answers.
And the formula is: [ ((Count (YES) + Count (NO / Gradient Answer 20 points)) / # of questions/criteria in scenario) * 100 ]
Therefore, it would apply like this:
((32+5)/45)*100= 82%