ROL-RMS
ROL-RMS: Web application for mapping, mitigating and monitoring corruption risks to which PA organisational processes are exposed
Vitality
Quick links
Description
# # Introduction
The web application for mapping corruption risks ‘ROL-RMS’ serves
to help bodies, public administrations, companies in which they participate – and
anyone interested in monitoring and managing corruptive risk —
* * to automatically quantify the corruptive risks * * to which their processes
they are exposed and directed to putting them into
Act * * the appropriate countermeasures * *.
The general workflow is divided into 4 separate workstreams or workstreams:
1. Step 1: loading of structures and processes
2. Step 2: calculation of the corruptive risk of each process
3. Step 3: choice of mitigation measures to be applied to each
process
4. Step 4: monitoring in order to verify whether the planned measures are
have been applied.
These 4 steps shall be carried out within a synchronous flow; they are thought to:
to be carried out in sequence, not in parallel. For example,
it is not possible to move to Step 2 unless Step 1 has been completed; nor is it
can move to Step 3 if Step 2 has not been completed; and so on.
This “linear” mode guides actors in the mapping process.
management and simplified management of the complexity of the
domain.
At the end of Step 4, a complete survey of the
calculation, treatment and monitoring of risk levels
corruption in organisation – all documented and certified
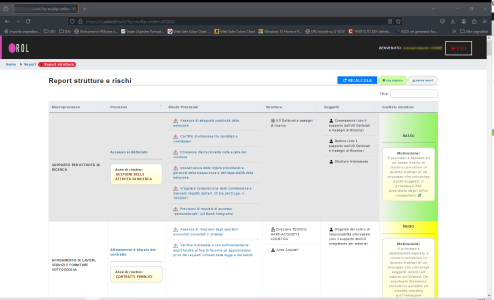
by means of specific reports, including downloadable reports.
At this point, the process can be iterated, proceeding with a new one.
detection; the system is in place for historicisation.
# # Entities involved
Those affected by the use of the software, i.e. the actors involved,
these are:
— The expert, or the office, anti-corruption and transparency
— The heads and operators of the offices of the organisation taken in
exam
— Software engineer
# # Operation
# # # Step 1: Context identification (organisational mapping)
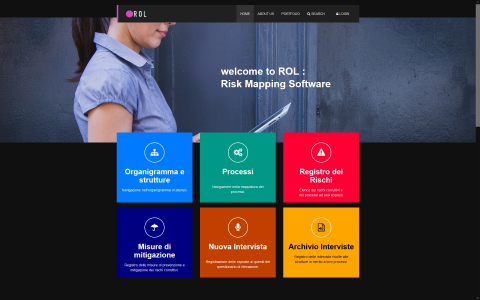
As a first step, the facilities are loaded.
organizational (organigram) and organisational processes which
they are produced by the structures themselves.
The software provides for specific navigation features in the tree of the
macro processes and organisational chart to verify
quickly that the mapping corresponds to what is actually present
in the organisation.
In addition, a detailed page is provided for each process.
containing all aggregated information relevant to the process
same, including: inputs, steps, outputs, risks and factors
enablers.
While the articulation of processes and structures is specific to each
organisation and therefore has to be prepared and uploaded every time the
software is deployed in a new organisation, there are some
“dictionaries” which are predefined and provided, already ready, in the case of a bundle of “dictionaries”, which are pre-defined and provided, already ready, on a bundle basis.
software: the risk register, the register of mitigation measures, the
dictionary of questions, enabling factors and others.
# # # Step 2: Risk calculation (interviews and risk indicators)
By consulting the mapping of processes carried out in Step 1, the Office
anti-corruption becomes able to consult * * list * * of
organisational structures involved in the delivery of the relevant processes.
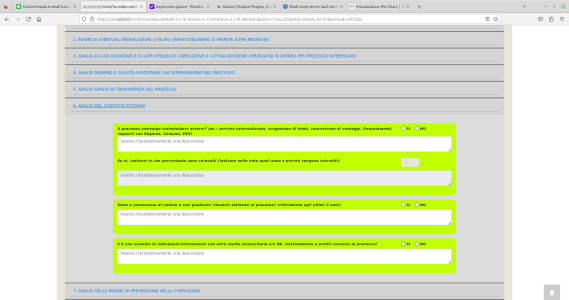
At that point, you can then put a number of * * questions * * to
managers and operators located in these facilities, concerning the
processes produced by the structures themselves.
By analysing the answers to these questions, application
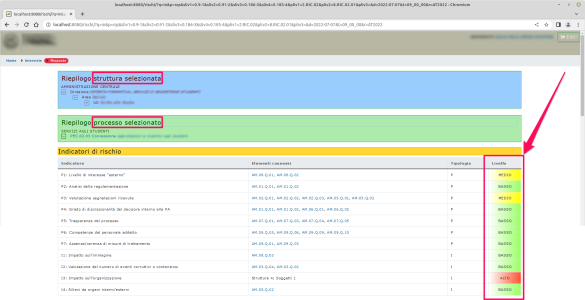
allows you to automatically obtain a set of * * indices * * relating to
specific corruption risks to which organisational processes are exposed
supervised by the facilities themselves: in practice, on the answers, the software
applies specific algorithms to identify the level of
* * PXi * * (level of risk * * Probability x Impact * *) * * * * of each
process examined.
Each question is linked to one or more specific risks.
corruptive; therefore, depending on the response given by staff
interviewed, the application calculates the level of risk to which the process
having been examined, it is clear that this is the case.
The battery of questions is large (more than 150) but the decision on which
questions to be administered can be determined from time to time
by the interviewer, in the sense that all questions are optional and there
these are more general questions, which are likely to make sense in every case.
interview, and more specific questions, which only makes sense to administer
if very specific processes are being considered.
# # # Step 3: Risk treatment (mitigation measures – estimation)
As a result, Steps 1 and 2 give an overall ratio on the
level of risk for each organisational process identified
exhibited.
Having carried out this mapping is a good starting point for
be able to determine which risk mitigation/prevention measures
it is appropriate to apply it to the risks themselves. This is phase 3.
or * * the phase of identification of mitigation measures to:
reduce the value of the risk. * *
Reference has been made above to the fact that a register of measures of
mitigation is provided natively by the software.
However, which measures are exactly chosen from among the various possible measures?
Either: how to identify the best measures for each risk of each data element
process?
Here too, the ROL-RMS system is helpful:
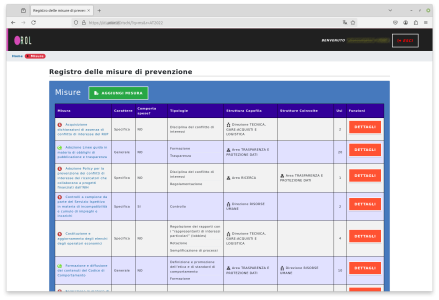
> * * one of the advantages offered by the software, on this side, is the fact that the system itself suggests which measures to apply to each risk in the context of each process. * *
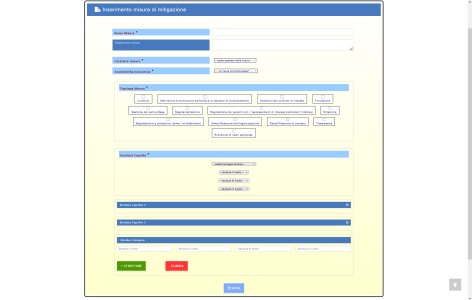
Mitigation measures, through their type, have:
an association with the enabling factor and this relationship renders
it is possible to identify the context in which the measures themselves are to be applied in
risk and process function.
Once the measures are applied, you can check how they vary
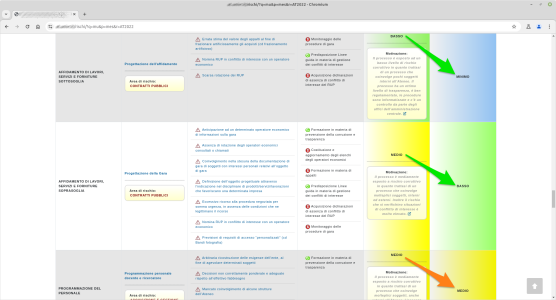
risk levels through consultation of appropriate dashboards, which
compare PXi before and after the measures are applied.
# # # Step 4: Risk certification (mitigation measures —
monitoring)
Predicting, or suggesting, that a measure will be applied to a
however, it does not automatically imply that it is actually done.
applied!
The allocation phase of the measures – i.e. Step 3 – makes it possible to
therefore, only obtain a risk-reduction estimate of the risk-reduction.
the proposed measures are applied (may be a big “SE_”). The phase of
monitoring, which concludes the corrupt risk management cycle.
it consists of checking whether the proposed measures were later
actually applied.
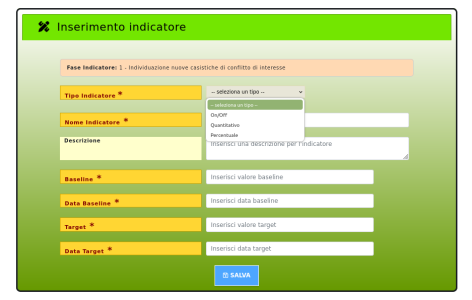
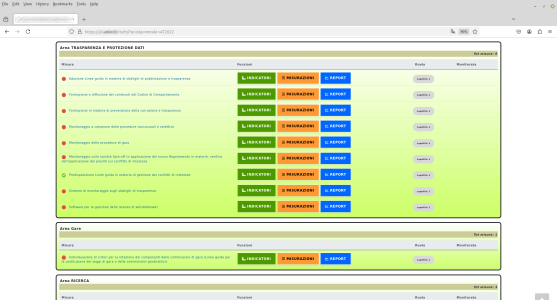
The Step 4 makes it possible to determine what measures were actually taken.
applied and thus makes it possible to calculate the actual value of the level of
risk, i.e. the actual and final value of the risk for each process
considered at the end of the measurement cycle (recognition).
> * * The software also offers specific analytical tools to verify to what extent the level of risk has changed not only depending on the hypothetical application, but also on the actual application of mitigation measures. * *
# # Subject Roles
Each entity has a specific task:
— The anti-corruption expert, with the help of the software, carries out the
risk calculation (Step 2), sets out which mitigating measures
apply and monitor the most risky processes (Step 3)
(Step 4).
— The staff of the offices overseeing the processes respond to the
questions (Step 2) and provide the values collected in monitoring (Step 4).
— The software engineer is responsible for the process mapping phase (Step 1).
it supports others through the entire workflow (all Steps).
# # Conclusions
Among the various functions currently implemented in the ROL-RMS software,
in particular, we would like to point out that there are 3 which can greatly ease the way in which it is easier.
the work of the Transparency and Anti-Corruption Office within the body that
adopts ROL-RMS solution:
— the automatic calculation of the existing risk;
— the automatic suggestion of mitigation measures to be applied
the existing risk;
— the production of comparative reports to consult developments in the
risk levels depending on the measures under hypotheses and those
applied.
As it stands (reference version: ‘2.1.1, December 2024’) on
software is already ready to be adapted, with minimal adaptation, to
any organisational reality wishing to carry out an analysis
details of the corrupt risks to which the processes provided
they are exhibited by the organisation itself.
# # # customisation
It is also possible to estimate, with relative precision, how much time is
necessary to customise the software to a specification
organisational reality. In fact, acquired:
— the size of the organisation (in particular the number of levels
of the organisation chart and the absolute number of structures to be mapped)
— number of levels and number of processes produced
by the organisation itself,
it becomes possible to make a relatively accurate estimation of time
necessary for the start of the interview campaign, and,
as a result, achieve the results of the various risk indicators and
of the summary judgment P x I.
# # # Storicisation
Any subsequent survey may be compared with the
previous by means of specific multi-detection dashboards, which
they will make it possible to analyse delta and trends relating to processes and
related corruption risks, from one detection to another, so that it is
finally, for the organisation, to carry out an assessment
changes in risk levels over the years.
Features
- Dynamic representation of mapped organisational structures and processes
- Dynamic representation of details of each organisational process
(phases, subjects, risks...) - Dynamic representation of corruption risk levels (PXi indices) to which each mapped process is exposed
- Dynamic representation of how the PXi corruption risk levels of processes would be reduced if a number of mitigation measures were applied
- Automatic calculation of the levels of corruptive risk of each process based on responses to a questionnaire addressed to staff providing the process
- Suggestion on the mitigation measures that should be applied to each given process (algorithm based on the n-aria association RISCHIO-PROCESSO-FATTORE ABILITANTE-TIPOLOGIA MISURA)
- Dashboards for monitoring and measuring the actions applied in order to reduce the risk of corruption
- Navigation and search functions, reports, graphs and summary tables

